A few months ago I read this post on reddit and another one I can no longer recall. This Journaly post is of a similar spirit and deals with the exact same topic: The vocabulary introduced in the Harry Potter series.
More concretely, the topic here is the distribution of new words in all Harry Potter books. Some days ago I was curious about something and I literally wanted to see the numbers. The graphics included in this text (in the links that'll follow) and the text itself are the outcome of my musings. I hope you'll find this text entertaining as well as informative. Welcome!
https://www.youtube.com/watch?v=8Ijk3nepXmM
Like I was saying, some time ago I got lost on reddit and, at some point, found myself staring at some curious graph made by an avid Harry Potter reader. The mentioned reader collected the data and crafted the plot in question by hand. In my case, I am not specially fond of losing so much time, so I've written a small computer program to automate the process of extracting the needed data and doing the data analysis I want. But I haven't told you yet what the main question and the goal of it is, so first things first.
Let's start with a bit of background information. A bit of context never hurt anyone.
I train the vocabulary of a given language using a self-made computer program. This program is mostly a poor man's book reader and vocabulary trainer. I'm using it already for some time, so I've accumulated a considerable amount of input, especially for languages such as Dutch and German. Recently, my focus has switched from "using the program" (i.e. accumulating data) to "extracting information" (i.e. analyzing the data). This post is not directly related to the data of my program, but it certainly is one of the outcomes of the process of having used it. So much about the context.
Let's finally start with the vocabulary in Harry Potter.
Why Harry Potter? Well, because it's what absolutely everyone out there reads in their target language. Just kidding. I simply happen to like Harry Potter, obviously, so why not using it for the data analysis?
What data analysis?
I was (for some weird reasons) interested in the following question: How many new words appear while reading Harry Potter, assuming someone doesn't know anything at the beginning but understands everything immediately (after having looked it up once, for example)?
Of course, this is a simplification of reality in several different aspects. First of all, the concept of "word" is grossly oversimplified: In my very crude data analysis, a "word" is simply a "sequence of characters" like "Dobby" or "Winky" or "asdf". A more professional analysis would include a lemmatization step to only consider the lemmas (the headwords, the dictionary forms of the words) and possibly exclude words of invented characters or places. Secondly, the assumption that we start by "knowing nothing" and nevertheless immediately "remember everything" is not just rude, but simply wrong: People don't usually start reading Harry Potter (or any other book) having no vocabulary in the chosen language and they surely don't remember absolutely everything at once.
Now that I've described the "problem" itself and its "model", let's present the results. Let's give some numbers.
All Harry Potter books contain over a million words. Concretely, splitting the book into words gave 1.062.740 words. These are all the words in all seven HP books, without repetitions. The number of unique words is obviously much lower (concretely: 24.275), but it's not of further interest in this post.
The computer program I wrote counted the number of new words every 100 words. This number is at the same time the percentage of encountered new words. The size of the sampling is, for sure, arbitrary. Why 100 and not 10, 50 or 12.345, for example? A hundred words simply seemed to be a reasonable number for the bins or buckets (yes, that's a technical term) of the range of values.
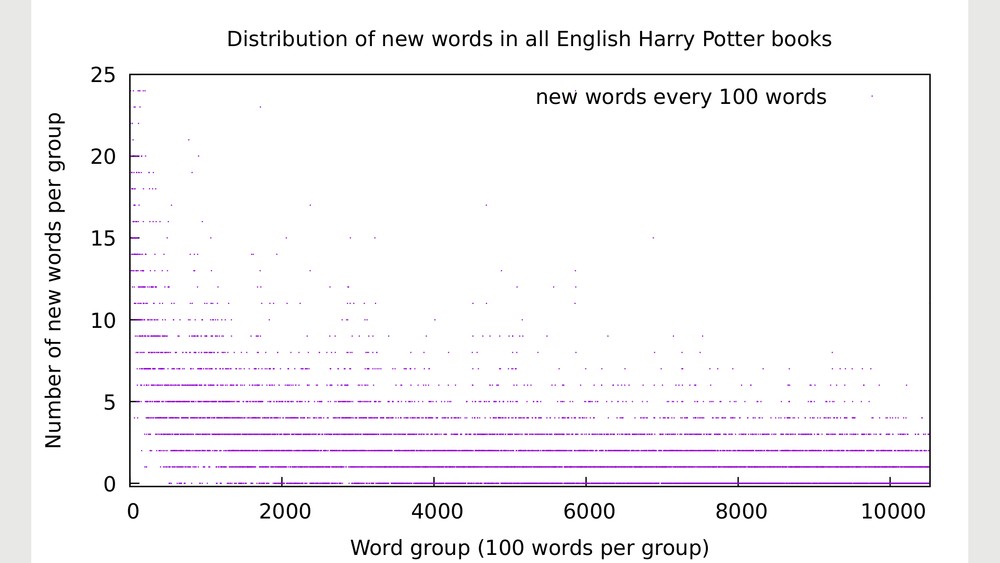
After letting the program count the number of new words in every group of hundred words, I made a scatter plot of the data to visualize the results. The result is https://i.imgur.com/tiJYyfe.png.
Nice, right?
Well, not really. The scatter plot does indeed show how the density of new words evolves, but (especially along the lines of 1% and 2%) it's quite difficult to visually distinguish the individual points of the graphic.
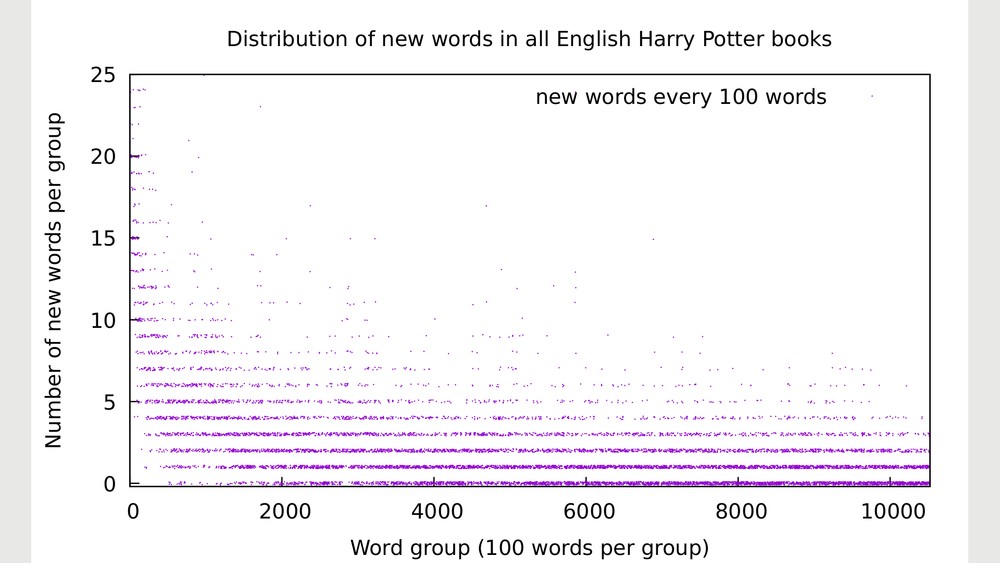
The next step was to add a tiny bit of randomness to the data. Or to be more blunt: I faked the results. Instead of values like "one new word" or "two new words" on a given page, every value was modified slightly. The result of this change is https://i.imgur.com/1g9lzP5.png.
If you're interested in the data, here it is: https://pastebin.com/6XJMj81F. The faked numbers are here: https://pastebin.com/U0BGmNPP.
The scatter plot https://i.imgur.com/1g9lzP5.png is the main result of the data analysis, and to be honest with you, I find it a nice wallpaper. It's a graphic with an amazing amount of information. For example: As one'd expect, the number of "zero new words" (i.e. known words) every page increases considerably over the course of the books. What I found surprising is, nevertheless, that even towards the end of the last book there is still a high amount of pages containing one or even two percent of new words.
Another interesting curiosity is the beginning of the line of "zero new words": The first point along that line is found quite late in the first book. In other words: The first time that no new words appear is exactly in this fragment of the first Harry Potter book:
... but it was a narrow corridor and if they came much nearer they’d knock right into him — the Cloak didn’t stop him from being solid.
He backed away as quietly as he could. A door stood ajar to his left. It was his only hope. He squeezed through it, holding his breath, trying not to move it, and to his relief he managed to get inside the room without their noticing anything. They walked straight past, and Harry leaned against the wall, breathing deeply, listening to their footsteps dying away. That had been close, very close. It was a few seconds before he noticed ...
This quotation gives a taste of the kind of information that the analysis provides. The quoted fragment corresponds to the information "hidden" in a single point of the scatter plot. Every single dot represents one such fragment of the book, containing a certain number of new words.
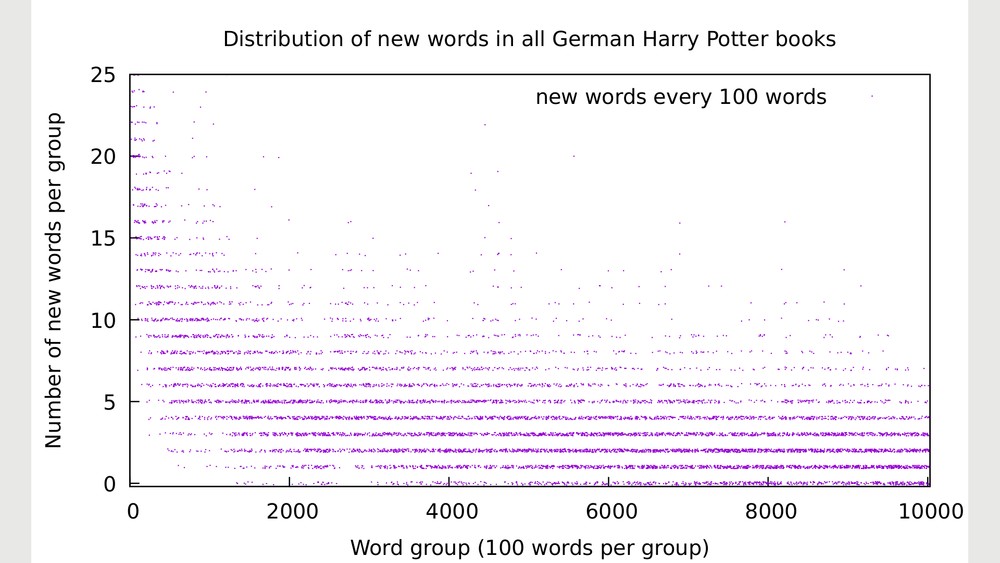
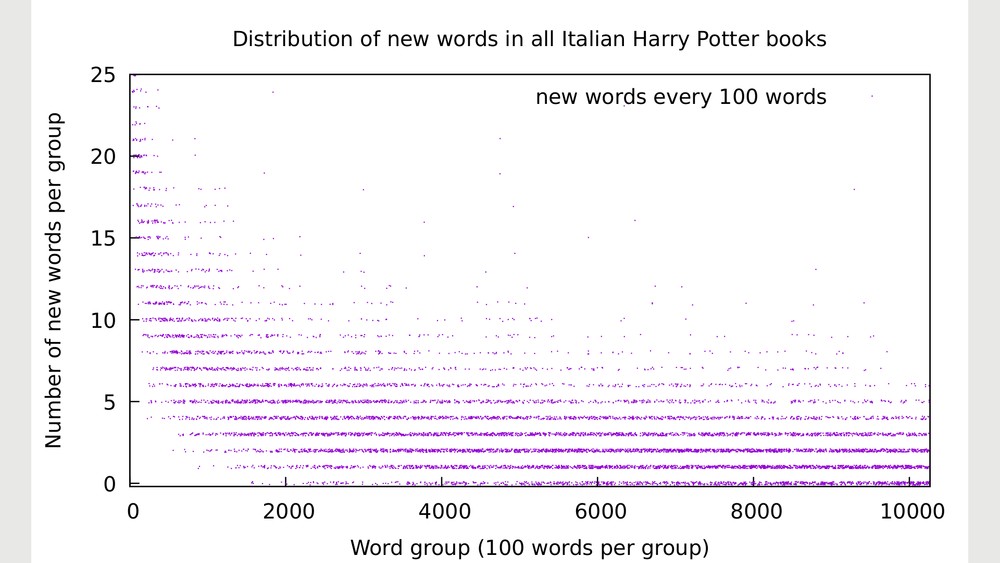
It's also interesting to compare the same analysis with the complete Harry Potter series (i.e. a comparable and representative amount of data) in different languages. In German it looks like
https://imgur.com/7ygwALL.png and for Italian it's
https://imgur.com/CHlygsX.png.
The comparison of the "regions of high density" is of considerable interest: Italian and German show a higher amount of new words towards the "end" (i.e. there are more new words that the reader constantly encounters). I found it also striking that the first group of 100 words containing no new words in the Italian and German translations is within the second book of the series.
Finally, to get a sense of how the "long-term behavior" of the graphic is, I made a linear and exponential fit of the data. The result is
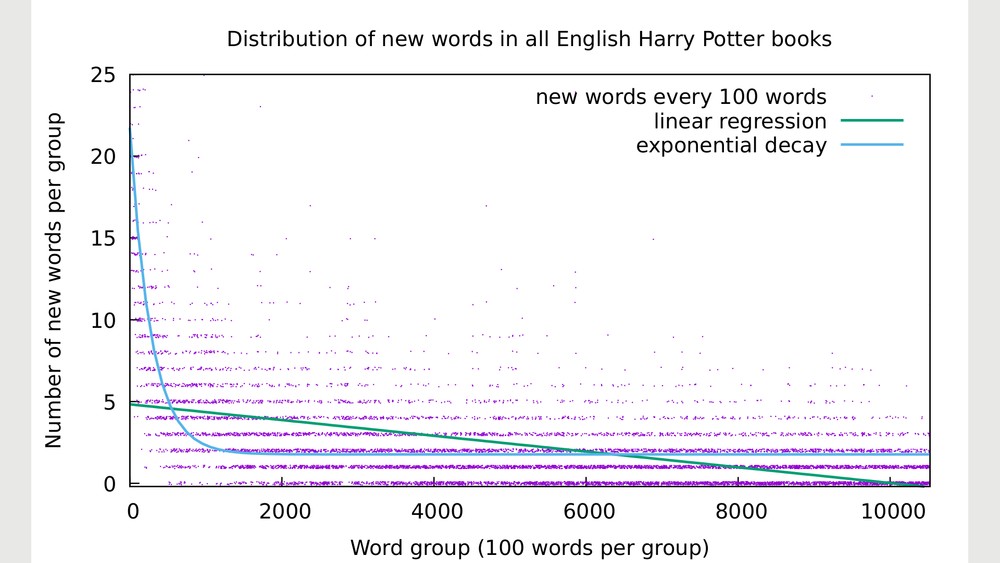
https://i.imgur.com/fpq4mPR.png. The linear fit (linear regression) doesn't adequately represent the experimental data (the dots), but the exponential decay arguabely does. If this curve is of any significance, it shows that there's an amount of approximately 1.77% of new words (constantly, from the second to the last book).
That's it for now. Ideally I'd like to make another data analysis considering my own vocabulary, and another one considering only the lemmas.
Bravo! I enjoyed the text and logic so much that I did not see anything to correct. I may find something on a second reading. I also learnt new words in my mother tongue, like "lemmatization". I am currently half way through reading "Der Schatten des Windes" in German and I have been wondering about exactly the question you have asked here: "when will the number of new words per page start decreasing materially?" I do not have the answer yet.
I presume that this sort of word distribution analysis has been done for the major languages over a significant sample of all published texts?
Hi Eduard, this is a question I never really thought about before but find it quite interesting. It proves just how many word there are at our disposal and that we'll probably never stop encountering new ones - even in our mother toungues. I find the difference between English and German / Italian quite striking. I'd bet it's due to conjugations, noun cases etc., so I'd be really curious to see the results of a lemmatised analysis.
Thank you, Peet! I already assumed you'd find the text interesting. It's partially inspired by one of your last German writings (this one: https://journaly.com/post/9494) :).
To try to answer your question about "Der Schatten des Windes": Here is the same graph for the distribution of new words in that book: https://i.imgur.com/bL0Myki.png. The (randomized) data is https://pastebin.com/VdVf77sr. A zoom between 0 and 25% (like the ones in the post) is https://imgur.com/xYSwPCZ.png. The exponential fit in https://imgur.com/evM8fWK.png with the function g(x)= b + k*exp(-x/u) gives (I'm using gnuplot for that) the quite crude values
b = 8.5436 +/- 0.2106 (2.465%), k = 28.9476 +/- 0.7992 (2.761%), u = 186.361 +/- 9.059 (4.861%).
I did the same for the first HP book, and in my opinion a single book is way too few input to be significant. In comparison, the error of the "b" parameter (the constant asymptotical value) for all HP books was of 0.something percent, which is quite precise.
That said, according to this, for "Der Schatten des Windes" there'll be approximately 8.5% new words within the last half of the book, on most pages.
Caro: Thank you for your corrections and comments!
Yes, the number of available/present new words is just insane. I find it striking that (statistically seen) there is a seemingly constant value/rate of "new words appearing on every page". It's not really constant, of course, but for the range of words within the HP series it is more or less a constant rate of new words. And this I find simply crazy :D.
Yes, the lemmatised analysis is of course a very interesting next thing to aim for, but that'd require a little bit more work and using some NLP tools or something (until now, it's everything "do it yourself"; I'm not using any big libraries or tools to extract and analyse the data). I'd have to look for what's available out there and more or less easy to use. I guess I'll use something like https://stanfordnlp.github.io/CoreNLP/lemma.html.
Eduard, thanks for the information on "Der Schatten". I presume that your analysis is on the German version? I would be really interested to see this analysis done using your own vocabulary.
Interesting post - and I learned what lemma and lemmatization is - two words I hadn't read before.
I have mentioned to you that I read German on LingQ. As a matter of interest, when coming across a new word, their system allows you to rate the word, using the following labels: New, Recognised, Familiar, Known and you can review your own data in those categories. Each time you come across the word again, you can change your rating until it is eventually "known".
Peet, yes, my last comment here refers to the German translation.
Ok, I'll try to do that next time :).
CloudyDe: Thank you! Nice to see you hoping around here.
Peet: Yes, you mentioned LingQ some days ago. Ah, I see. I didn't know about their "levels" and how these are called. I find it interesting to know, for the comparison.
Funnily the levels "recognised" and "familiar" seem to be more or less equivalent to the levels "GUESSED" and "COMPREHENDED" in my program (well, not quite, perhaps). In my case I don't have any label for "new" words: These are simply the words in any given book that are not present in the vocabulary that the program uses. My definition of "new" is simply the words a user has never entered in the program. Additionally, I added further levels beyond "KNOWN", concretely the levels "WELL_KNOWN" and "MASTERED".
In case you're curious, I wrote more about it some time ago in this Journaly post (in German): https://journaly.com/post/5195.
Very interesting post! Was there anything that surprised you when you analysed the data?
Caro (back to your comment): I just did a lemmatized analysis (for the English books of the HP series). The resulting scatter plot is https://imgur.com/fJxGWD2.png. The same with the fitted curves is https://imgur.com/9vAVUnK.png.
Now tell me whether you find the result interesting and/or surprising or not ;). [I do!]
Chocolate_Frog: Thank you! It's somehow logical that a chocolate frog finds a data analysis of the Harry Potter series appealing :D.
Sure there is: I found it surprising to see such a high rate of constantly appearing new words! I obviously expected to find "some" new words appearing every now and then, but it did surprise me to see that it's a lot more than expected. I'd have thought the dots in the scatter plot "gather" around the "zero words" towards the end of the book(s), but that's not the case.
Eduard, I wonder also if this is a feature of fiction writing, where authors strive to express themselves in new and interesting ways, drawing from the vast universe of available words? It might look different for an analysis of, say, news broadcasts over time, which might however be deadly dull and boring!
Peet, that's of course a very interesting question!
I already wondered myself WHY it may be like that (I have no clue :D). It may be like Caro says (there is a sheer amount of 'vocabulary' that is constantly available to us), or it may be like you say (there is a big amount of available words, but only when writing 'creatively' you constantly encounter new terms). I guess it's to a high degree a mixture of both views, but in my opinion I see it more like Caro does (it is a feature of the language, not of a certain kind of writing).
You could judge by yourself by taking a look at what kind of new words are found towards the end of the series (i.e. the raw data of my analysis): https://zerobin.net/?2e585f4328e4e5be#Vfz0phXHOzNKvU/OmMQmRMwIp1v3+Fqnoejt6qiUkVg= contains the precise distribution of new words in the book. The distribution of new LEMMAS is https://zerobin.net/?5879988b155b5741#sYj5oxu2TAxLxVnGMobIY8uJ9OEd8gZRWfnuXSqXzTA= and it shows that, in my opinion, it is indeed a mixture of relatively common words and quite weird ones :D.
Before writing this text, I made another plot of the distribution of new words in all my English books that I loaded into my program (56 different documents, mostly about physics, programming, math, HP and the like) and there was as well a similar constant rate of new words (smaller in number than only for HP, obviously).
Eduard, on the one hand, the number of new words per 100 words doesn't decrease as much as I'd have expected. On the other hand I think that the difference would be much more noticeable in Romance languages and German, for reasons already mentioned. It would be interesting to see the results for other languages. I'd assume that the curve would behave in a similar way because in the end, they all tell the same story.
Peet, I think if Eduard took transcripts of a bunch of news broadcasts and analysed them, the findings would be similar. I wouldn't even be surprised if the rate of new words was even higher, because the news cover a whole range of constantly changing topics, depending on what's happening in the world. Just think of all those new words we've learned throughout the pandemic so far :D
Nice to see that Peet unlocked the Odradek as well.
"Odradek" ... another new word!
As far as the rating on LingQ goes, it is the same yours in that a new word (to you) is automatically marked as "new" and you have to change the rating from there on as you come across the word. There also effectively a level beyond "known", which I guess will be similar to your "mastered". So very similar indeed.
I'm not the only one doing weird programs to answer questions who seams stupid because it's just interesting and fun! And then you discover things you never thought about ahah It was a very nice text!
:D Thank you! Such a nice comment.
Hi Eduard,
I really like the way you're juggling numbers 🔢! You could easily write another post or two with all the additional information in the comments 😅
Thank you, Linda! Then I guess you'll definitely like the topic of the next post that I'm already preparing. It requires programming a couple of things first, which I mostly have by now, but I'll
have to wait a couple of days to really be able to dedicate the needed time to the remaining parts. Or maybe I decide to write several small posts about it, I'm not sure about that yet. Actually the posts are just a by-product of it; what I'm working on is more related to Journaly as a platform (you know exactly what I'm talking about, I guess ;)).
Wow thanks for that nerdy work! I really loved it :-). Keep up with that! Currently reading Harry Potter in french and so i was very happy to see your post. :)
Hi, Dustin! Thanks, man. I just bumped my old post from 5 months ago now that I can finally add images to it :). I'm glad to see it attracted a new reader :D. I've written similar posts (you may enjoy reading https://journaly.com/post/12864), and there'll be definitely more coming in the near future. As Lynn said, apparently I can turn any piece of content into a statistical matter with a lot of data, so I'll try to keep up with the high expectations from my readers 😆.
Thanks i definitely will have a look! Yes kind of an art to see stuff in a different way :).